The projects on this page was created for a Visual and Design Fundamentals class at the CUNY Graduate Center. Tableau was used in creating these projects.

How do countries arounds the world observe their holidays?
Final Project
This project explores the various holidays celebrated across the world according to national, religious, and cultural traditions.
You may see this visualization on Tableau.
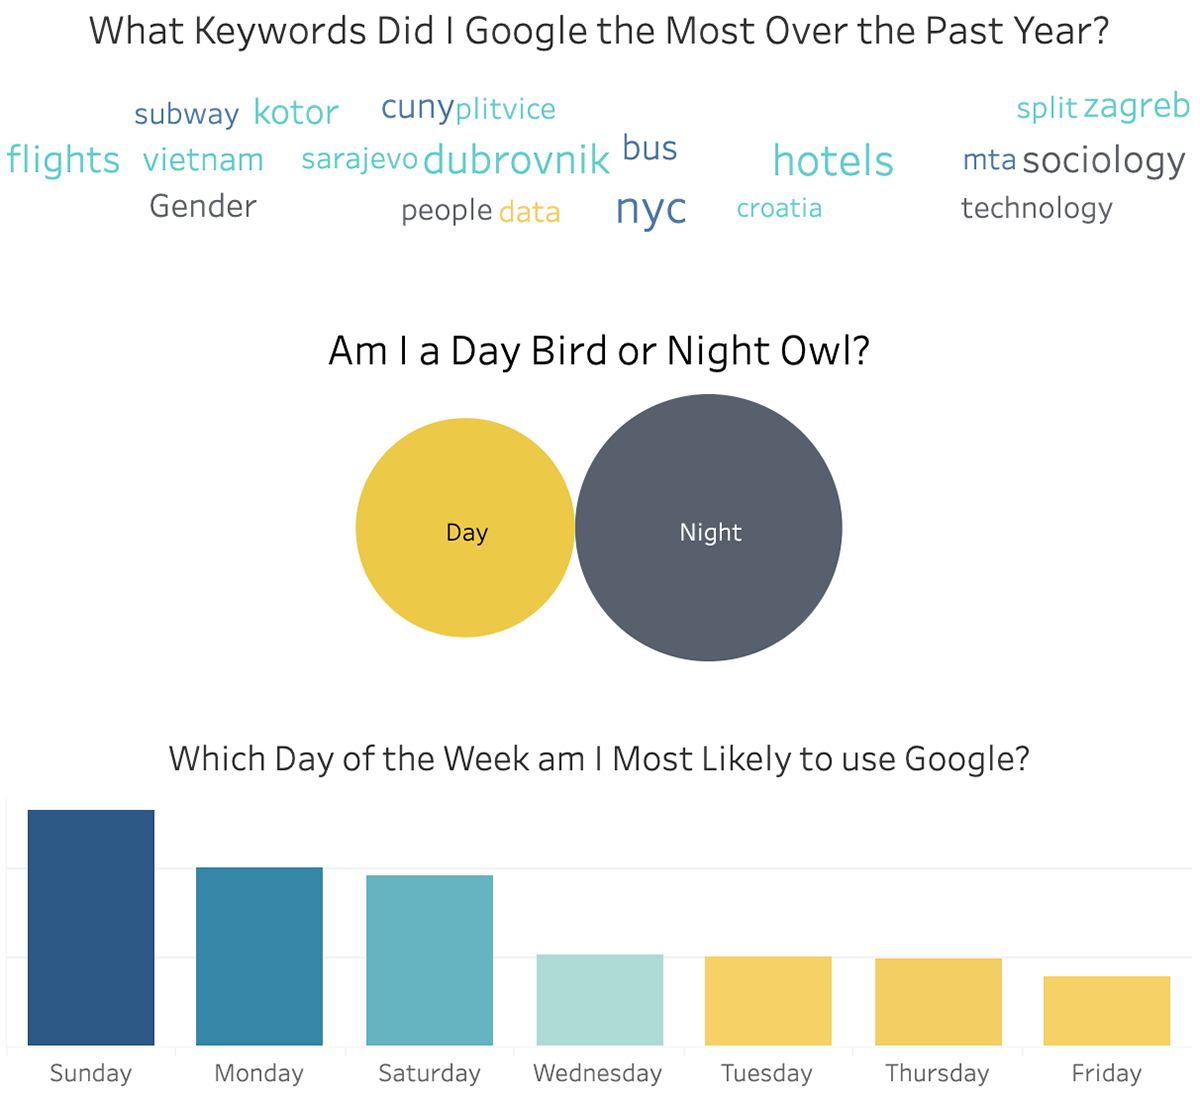
What do my Google search terms say about me?
Quantified Self Project
This project explores the trends of my Google searches over a one year segment. This analysis was then categorized according to the Big Five Personality traits theory.
You may see this visualization on Tableau.

What illegal animal receives the most complaints in NYC?
NYC 311 Project
This project explores the number of complaints made to 311 about illegal animals in New York City.
You may see this visualization on Tableau.